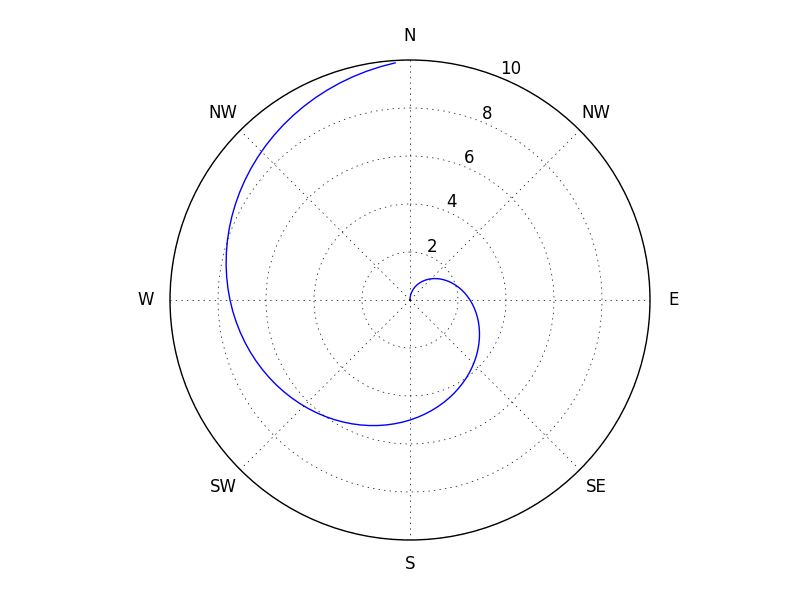
極座標グラフを、12時から時計回りで使う。
Developer's guide for creating scales and transformations — Matplotlib 3.0.2 documentation
のPolarAxesに書いてあるとおりだとは思うのですが、備忘録。
import numpy as np
import matplotlib.pyplot as plt

ps = plt.subplot(polar=True) #極座標でfigure(1)とsubplot(111)を作って
ps.axes.set_theta_direction(-1) #デフォルトは反時計回りなので、時計回り(-1)に変えて
ps.axes.set_theta_zero_location('N') #上を0にする。(NはNorthの意味)。
#ps.axes.set_theta_offset(0.5 * np.pi)でも可。
#引数はラジアンで、普通の極座標形と一緒。0.5*piで上ってこと。

#座標軸のラベルとかを変えたければ、
#ps.axes.set_rgrids()
#ps.axes.set_thetagrids()とかで、指定する。
ps.axes.set_thetagrids(np.arange(8)*45.,['N','NW','E','SE','S','SW','W','NW'])
#ラジアンじゃなくて度らしい。

#適当にデータ(thetaとrの100組)を作る
theta = np.arange(0.,2.*np.pi,2.*np.pi/100)
r = np.arange(0.,10.,10./100.)

#でプロットする
plt.plot(theta,r)
